
Correlation: Don’t jump to conclusions, but jump at the chance to explore
In the world of data, it’s easy to see a pattern and jump to conclusions. But just because two variables move together, it doesn’t mean one causes the other.
The classic example used in any statistics course is the link between ice cream sales and drowning incidents. There is a strong positive correlation between the two*, but it’s absurd to think buying an ice cream will lead to drowning in the sea.
So, what is a common denominator here? Summer weather. The better the weather, the more likely people are to buy ice cream and go to the beach for a swim.
At Flare, we understand the importance of digging deeper into the data. We are now able to run correlation analysis across all our ingested data. This means that there is now a score for all variables matched against another in our database.
So, if you want to discover what the relationship between a country’s GDP and its spending on public services, it can be done. If you discover a strong positive or negative correlation (i.e. when one variable goes up, the other goes down) then ask Flare for other variables that share similar scores.
Without having to touch a spreadsheet or run any calculations, you can very quickly establish what variables are worth investigating further to find the underlying cause of your question.
Here’s one for you to ponder. Flare has discovered a relatively strong inverse relationship between the population of Germany’s general happiness (Source: World Happiness Report) and mean inflation (Source: IMF) over a period. The inflation levels are on the right-hand Y axis.
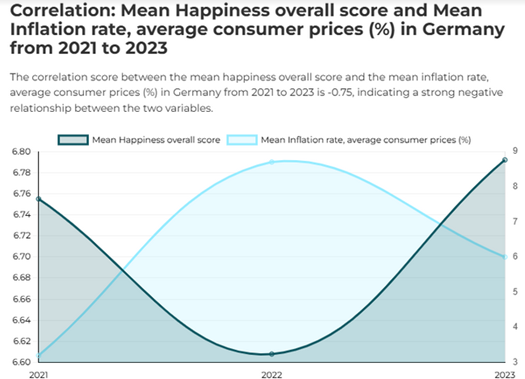
Does it mean the higher consumer costs get the unhappier people become? More than likely, but what other factors could be at play here? Let us know if you’d like to dig deeper.
Whether you’re in finance, healthcare, or retail, understanding the true drivers behind your data is crucial. Let us help you separate the signal from the noise.
*The strength of the relationship is reflected in the score. A score of 1 or -1 represents a perfect positive and negative correlation between the variable. A score of 0 represents no discernible relationship.